Create a Chart
A chart shows a different perspective of consumption information. Customer service uses charts to show usage and other information to customers. You can email or print charts, or add a second meter for a side-by-side comparison. For example, compare consumption at a customer's previous address with consumption at the current address.
To create a chart:
-
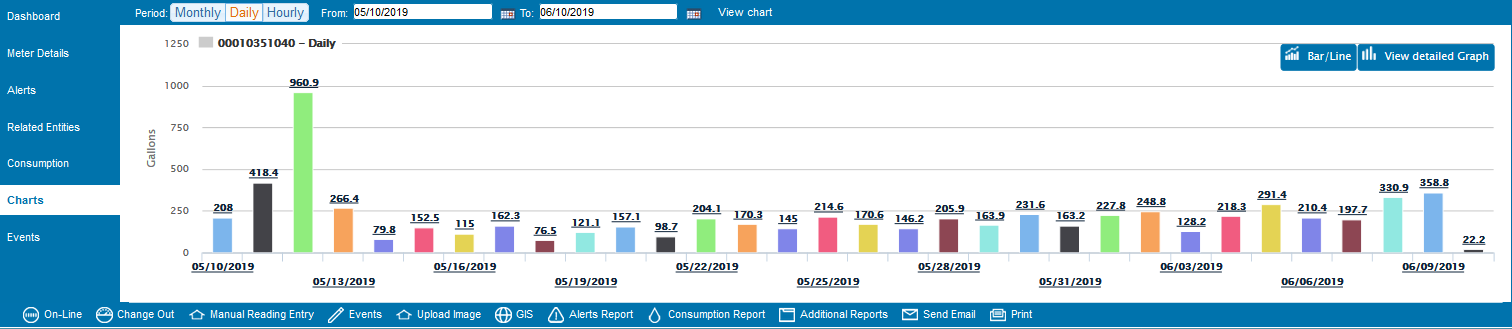
From the Meter Card, select Charts on the left navigation menu. Consumption information displays in a bar graph by default.
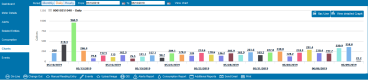
- To create another style of graph, use the Bar/Line and View Detailed Graph buttons.
- To adjust the time frame, modify the Period, From, and To fields. You must click View Chart (to the right of these fields) for the graph to repopulate after adjusting the time frame.
- To view data in table format, select the Data Options link on the lower left. This option is available only after you've clicked View Detailed Graph.
Toll Free: 800.928.6388
Web: www.mastermeter.com
Address: 101 Regency Pkwy, Mansfield TX 76063
Harmony™ is a trademark of Master Meter, Inc. Copyright © 2019 Master Meter, Inc. All Rights Reserved.